Account # 3
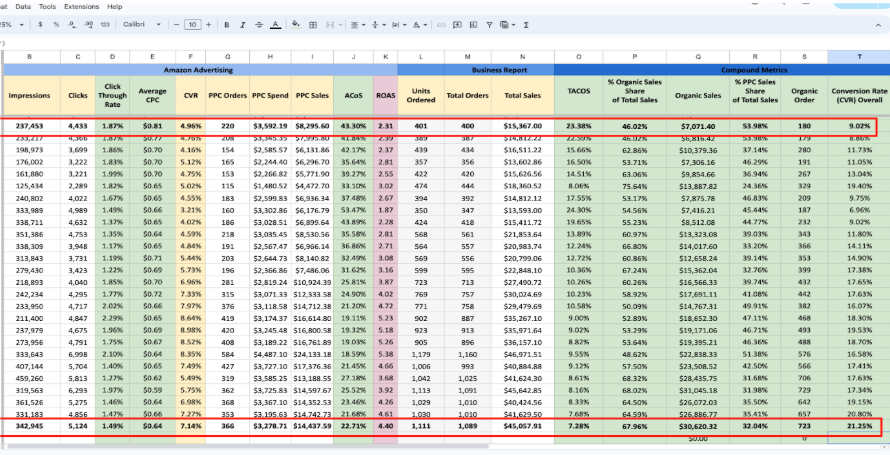
 I began managing this Amazon account on January 17, 2025. During the first week of handling the account, advertising performance showed a heavy dependence on PPC for overall sales, indicating limited organic visibility.
Initial Performance (Week 1)
- PPC Spend: $3,592.19
- PPC Sales: $8,925.60
- ACOS: 43.30%
- Total Sales: $15,367
Sales Source Breakdown
- Organic Sales: 46.02%
- PPC Sales: 53.98%
At the time, most sales were coming from paid advertising, which meant the listings had weaker organic rankings and relied heavily on PPC to generate revenue.
My goal was to:
- Improve PPC efficiency and reduce ACOS
- Scale profitable advertising sales
- Use PPC strategically to improve organic ranking
- Increase total account revenue
The long-term objective was to shift the account from PPC-heavy sales to stronger organic-driven growth. To achieve these goals, I implemented a data-driven PPC optimization strategy.
- Identified and paused underperforming keywords and targets that generated spend without sufficient returns.
- Adjusted bids based on performance and profitability.
- Analyzed the Search Term Report to identify high-converting search terms.
- Harvested converting search terms into more focused campaigns to scale profitable traffic.
- Added negative keywords to eliminate irrelevant search terms and reduce wasted ad spend.
- Shifted advertising budget toward top-performing campaigns and keywords.
- Conducted regular optimization through:
- Bid adjustments
- Keyword harvesting
- Search term negation
- Budget allocation improvements
After six months of continuous optimization, the account showed significant improvements in efficiency, total sales, and organic growth.
Performance After 5 Months
(May 12–18, 2025)
- PPC Spend: $3,278.71
- PPC Sales: $14,437.59
- ACOS: 22.71%
- Total Sales: $45,057.91
Key Results
ACOS Improvement
- Reduced from 43.30% → 22.71%
PPC Sales Growth
- Increased from $8,925 → $14,437
Total Sales Growth
- Increased from $15,367 → $45,057
Organic Growth
- Sales distribution improved from:
- 46.02% Organic / 53.98% PPC
to - 67.96% Organic / 32.04% PPC
- 46.02% Organic / 53.98% PPC
This shows that the majority of sales are now coming from organic traffic, indicating improved product ranking and stronger marketplace visibility.
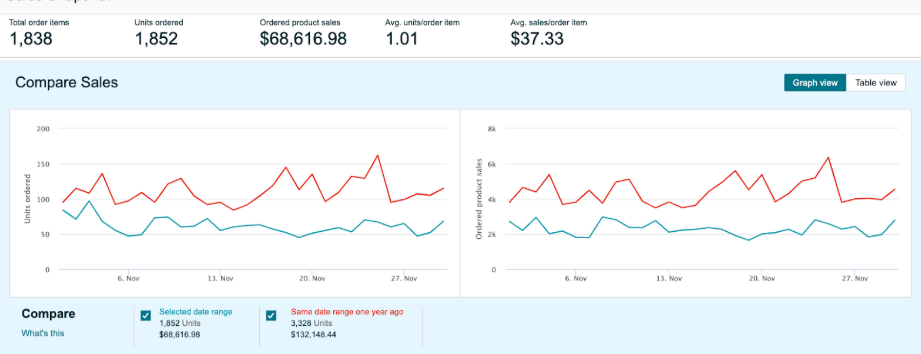
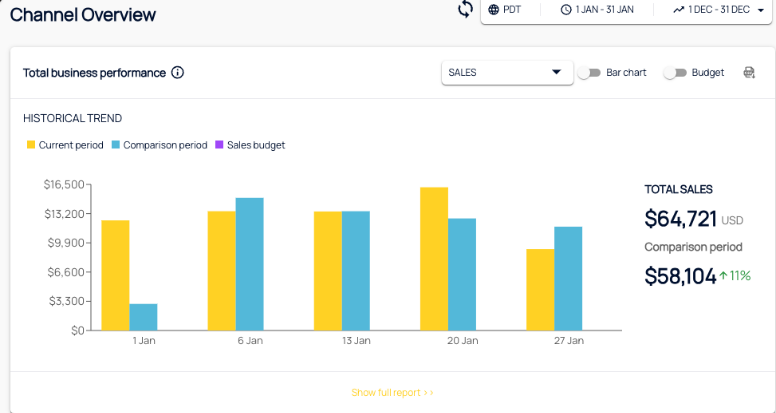
Some products were discontinued by the client, which resulted in a sales gap when compared to the previous year’s performance.
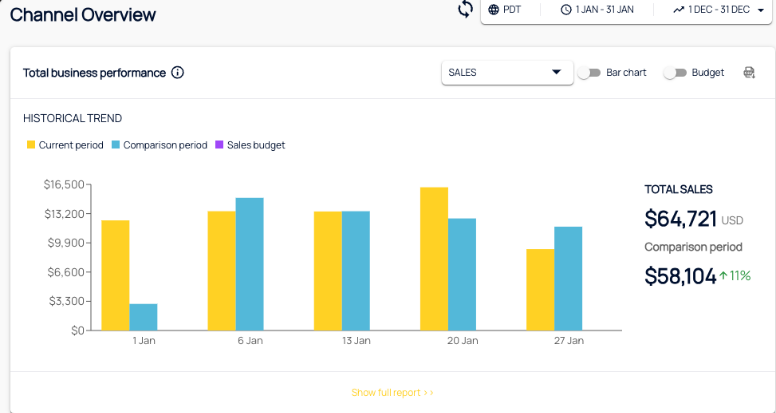
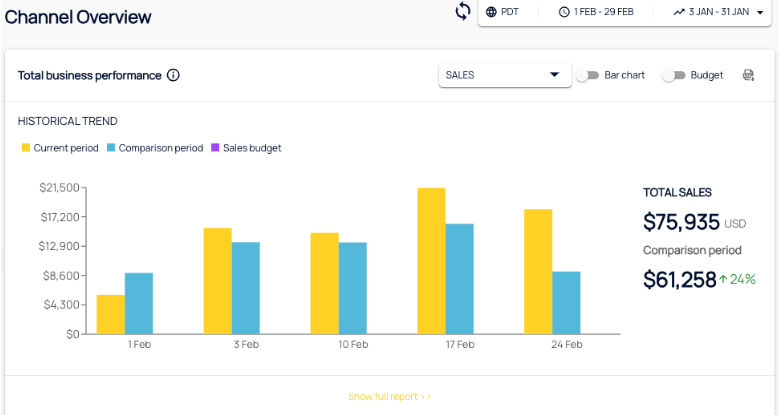
However, despite the reduced product catalog, the account began generating stronger results in 2025, with total sales starting to grow month over month. By January 2026, total sales had already surpassed December 2025, signaling the start of consistent sales growth.
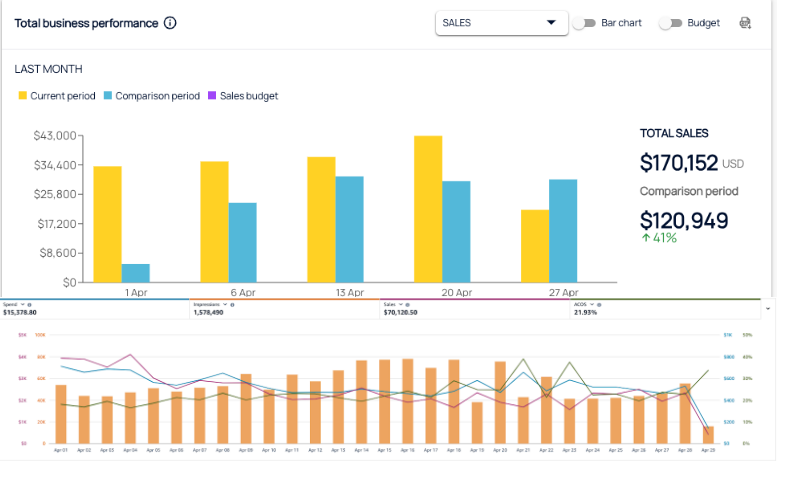
February 2025 vs January 2025
February 2025 Advertising Report
March 2025 vs Feb 2025
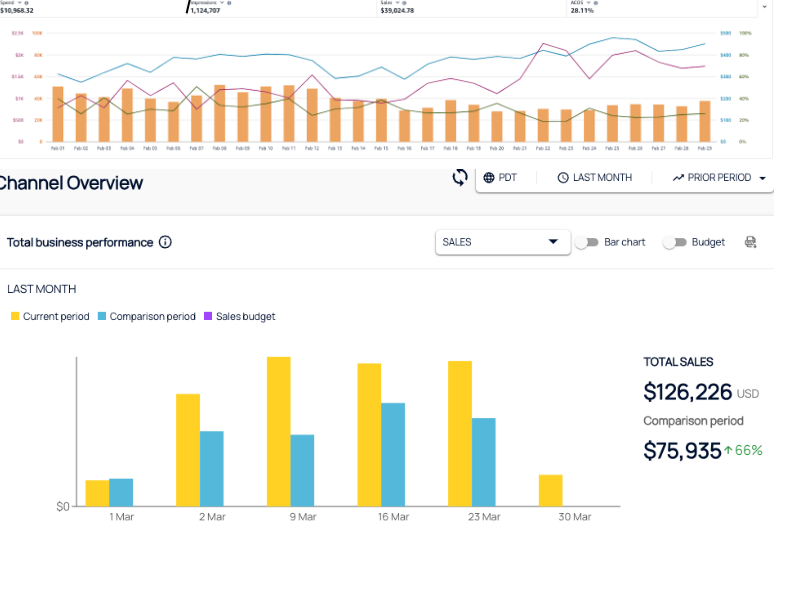
April 2025 vs March 2025